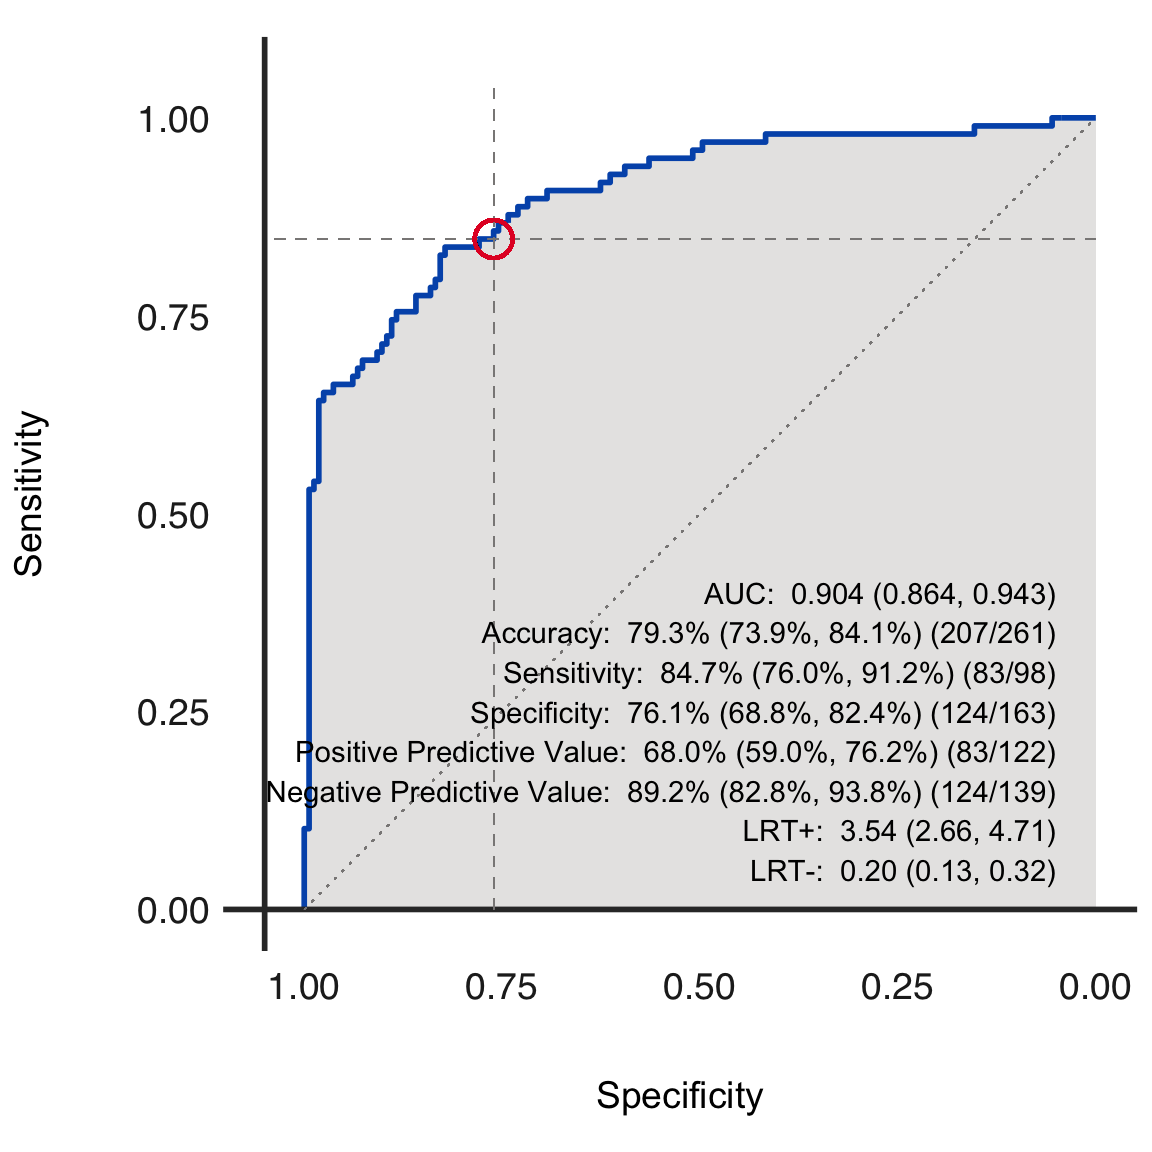
Plot ROC curve for a dx object
dx_roc(
  dx_obj,
  curve_color = "#0057B8",
  fill_color = "#cfcdcb",
  text_color = "black",
  add_text = TRUE,
  add_ref_lines = TRUE,
  add_fractions = TRUE,
  axis_color = "#333333",
  add_ref_circle = TRUE,
  ref_lines_color = "#8a8887",
  circle_ref_color = "#E4002B",
  summary_stats = c(1, 2, 3, 4, 5, 6, 7, 8),
  filename = NA
)
Arguments
- dx_obj
An object of class dx
- curve_color
Color of ROC curve
- fill_color
Color to be filled in under the ROC curve. Use "transparent" if you do not want a color to show.
- text_color
Color of text on ROC curve
- add_text
(Logical) Include stats on ROC curve?
- add_ref_lines
(Logical) Include reference lines on ROC curve?
- add_fractions
(Logical) Include fractions on ROC curve?
- axis_color
Color of x and y axis
- add_ref_circle
(Logical) Include a circle around specificity and sensitivity at the specified threshold?
- ref_lines_color
Color for reference lines
- circle_ref_color
Color of reference circle
- summary_stats
Statistics to include on ROC curve
- filename
File name to create on disk using ggplot2::ggsave. If left NA, no file will be created.