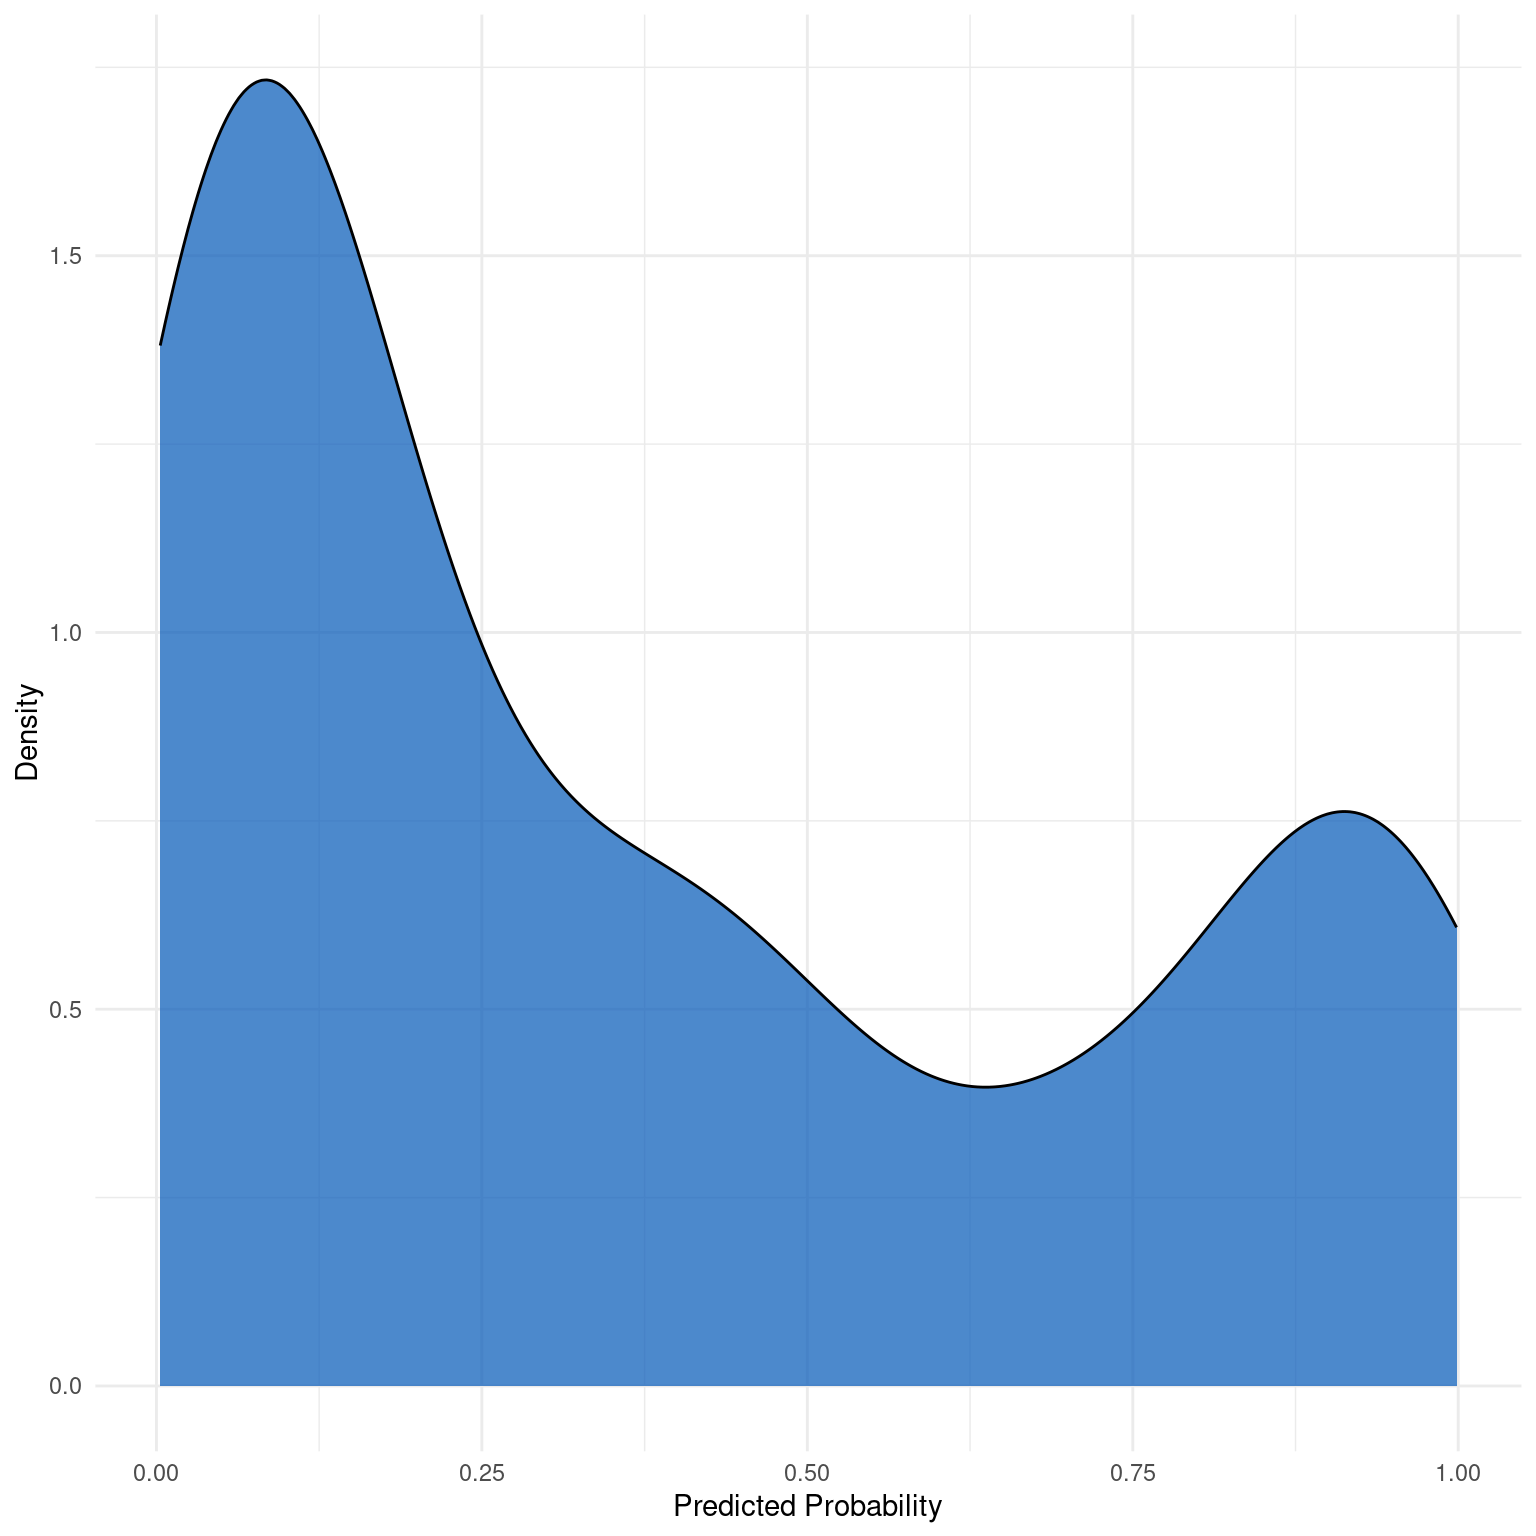
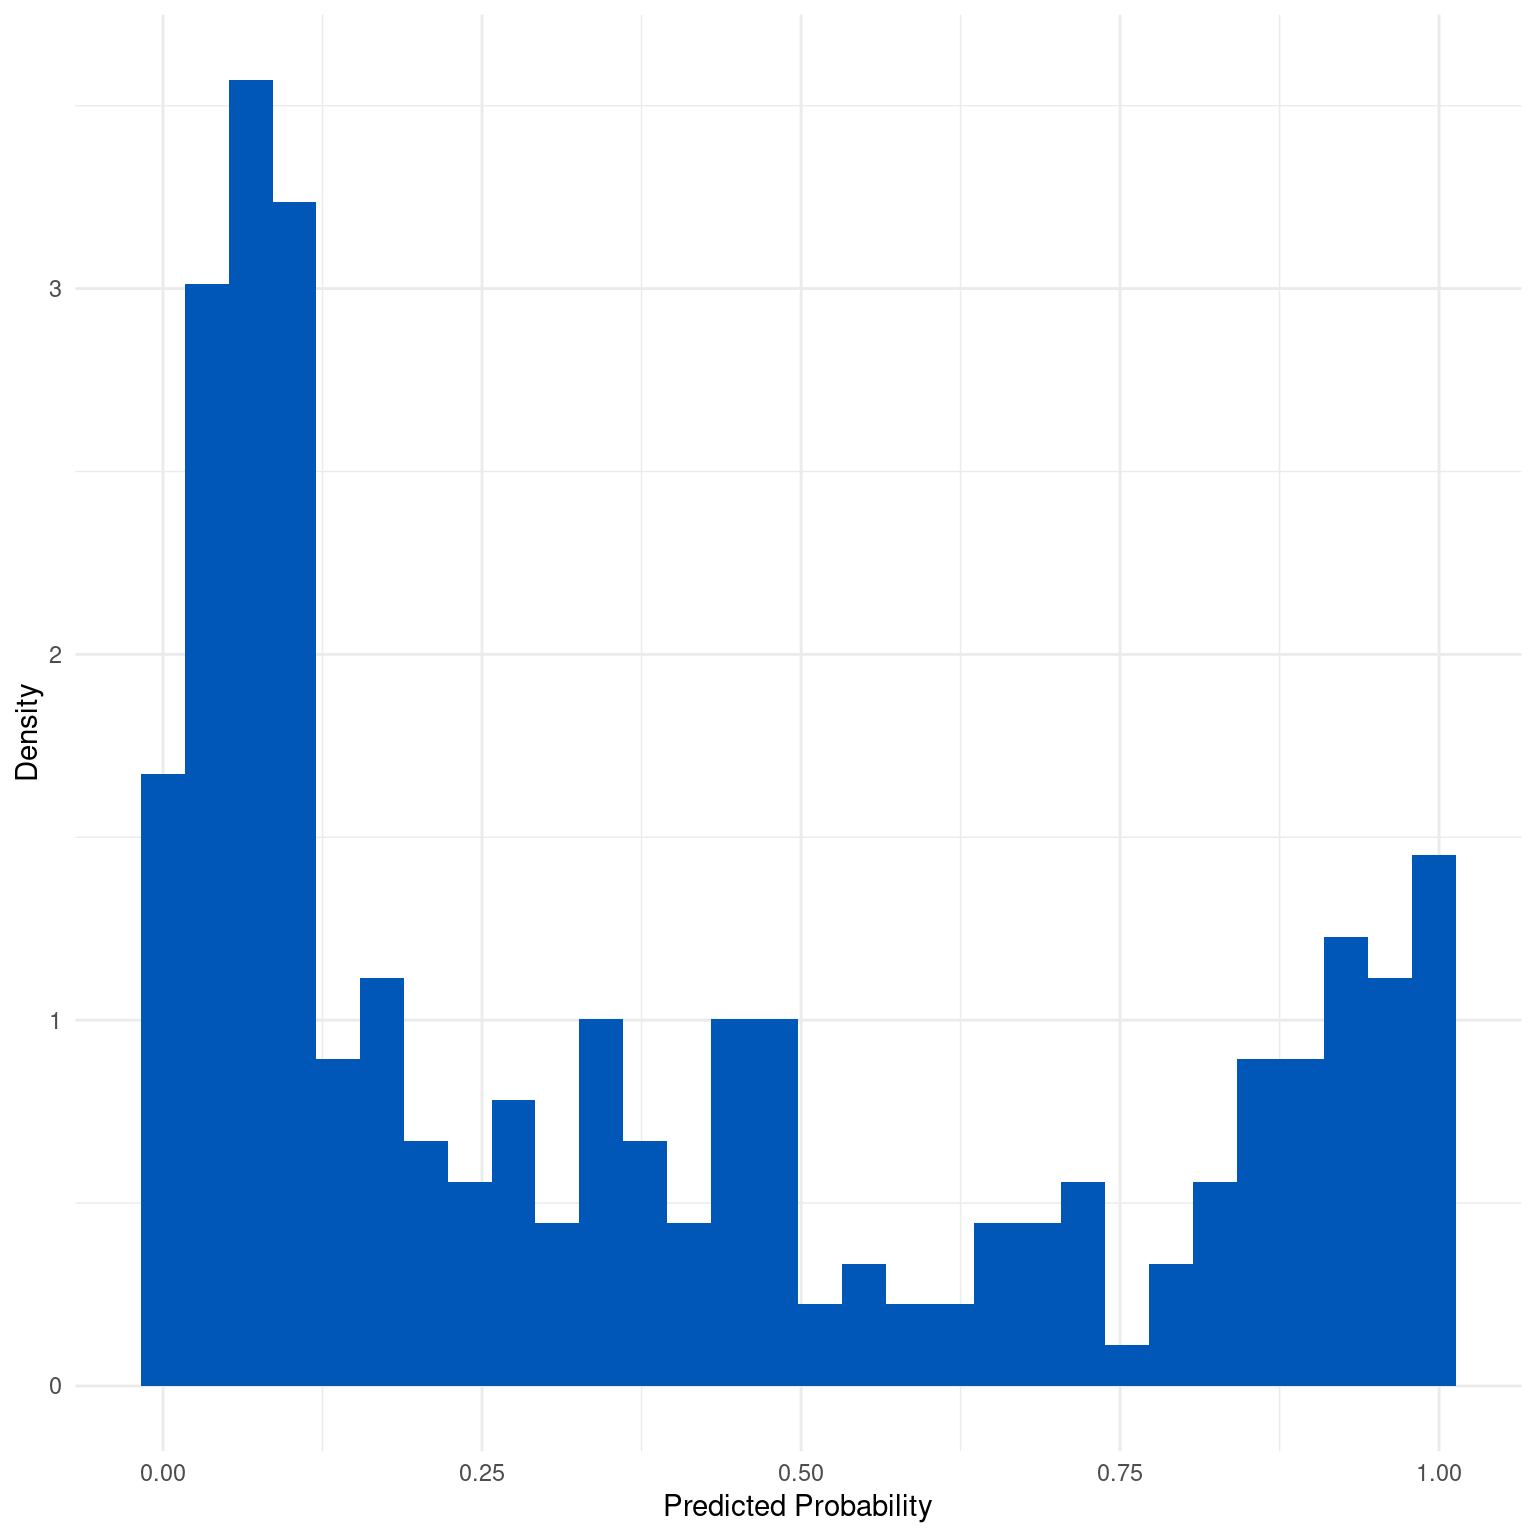
Generates a plot showing the distribution of predicted probabilities.
Offers options to show as a histogram or density plot.
Usage
dx_plot_probabilities(
  dx_obj,
  plot_type = "histogram",
  bins = NULL,
  fill_color = "#0057B8"
)
Arguments
- dx_obj
A dx object
- plot_type
Character string specifying the type of plot: "histogram" or "density".
- bins
Optional; number of bins for the histogram (relevant if plot_type = "histogram").
- fill_color
Color to fill the bars or density plot.
Value
A ggplot object representing the distribution of predicted probabilities.
Examples
dx_obj <- dx(
  data = dx_heart_failure,
  true_varname = "truth",
  pred_varname = "predicted",
  outcome_label = "Heart Attack",
  setthreshold = .3
)
dx_plot_probabilities(dx_obj, plot_type = "histogram", bins = 30)

dx_plot_probabilities(dx_obj, plot_type = "density")