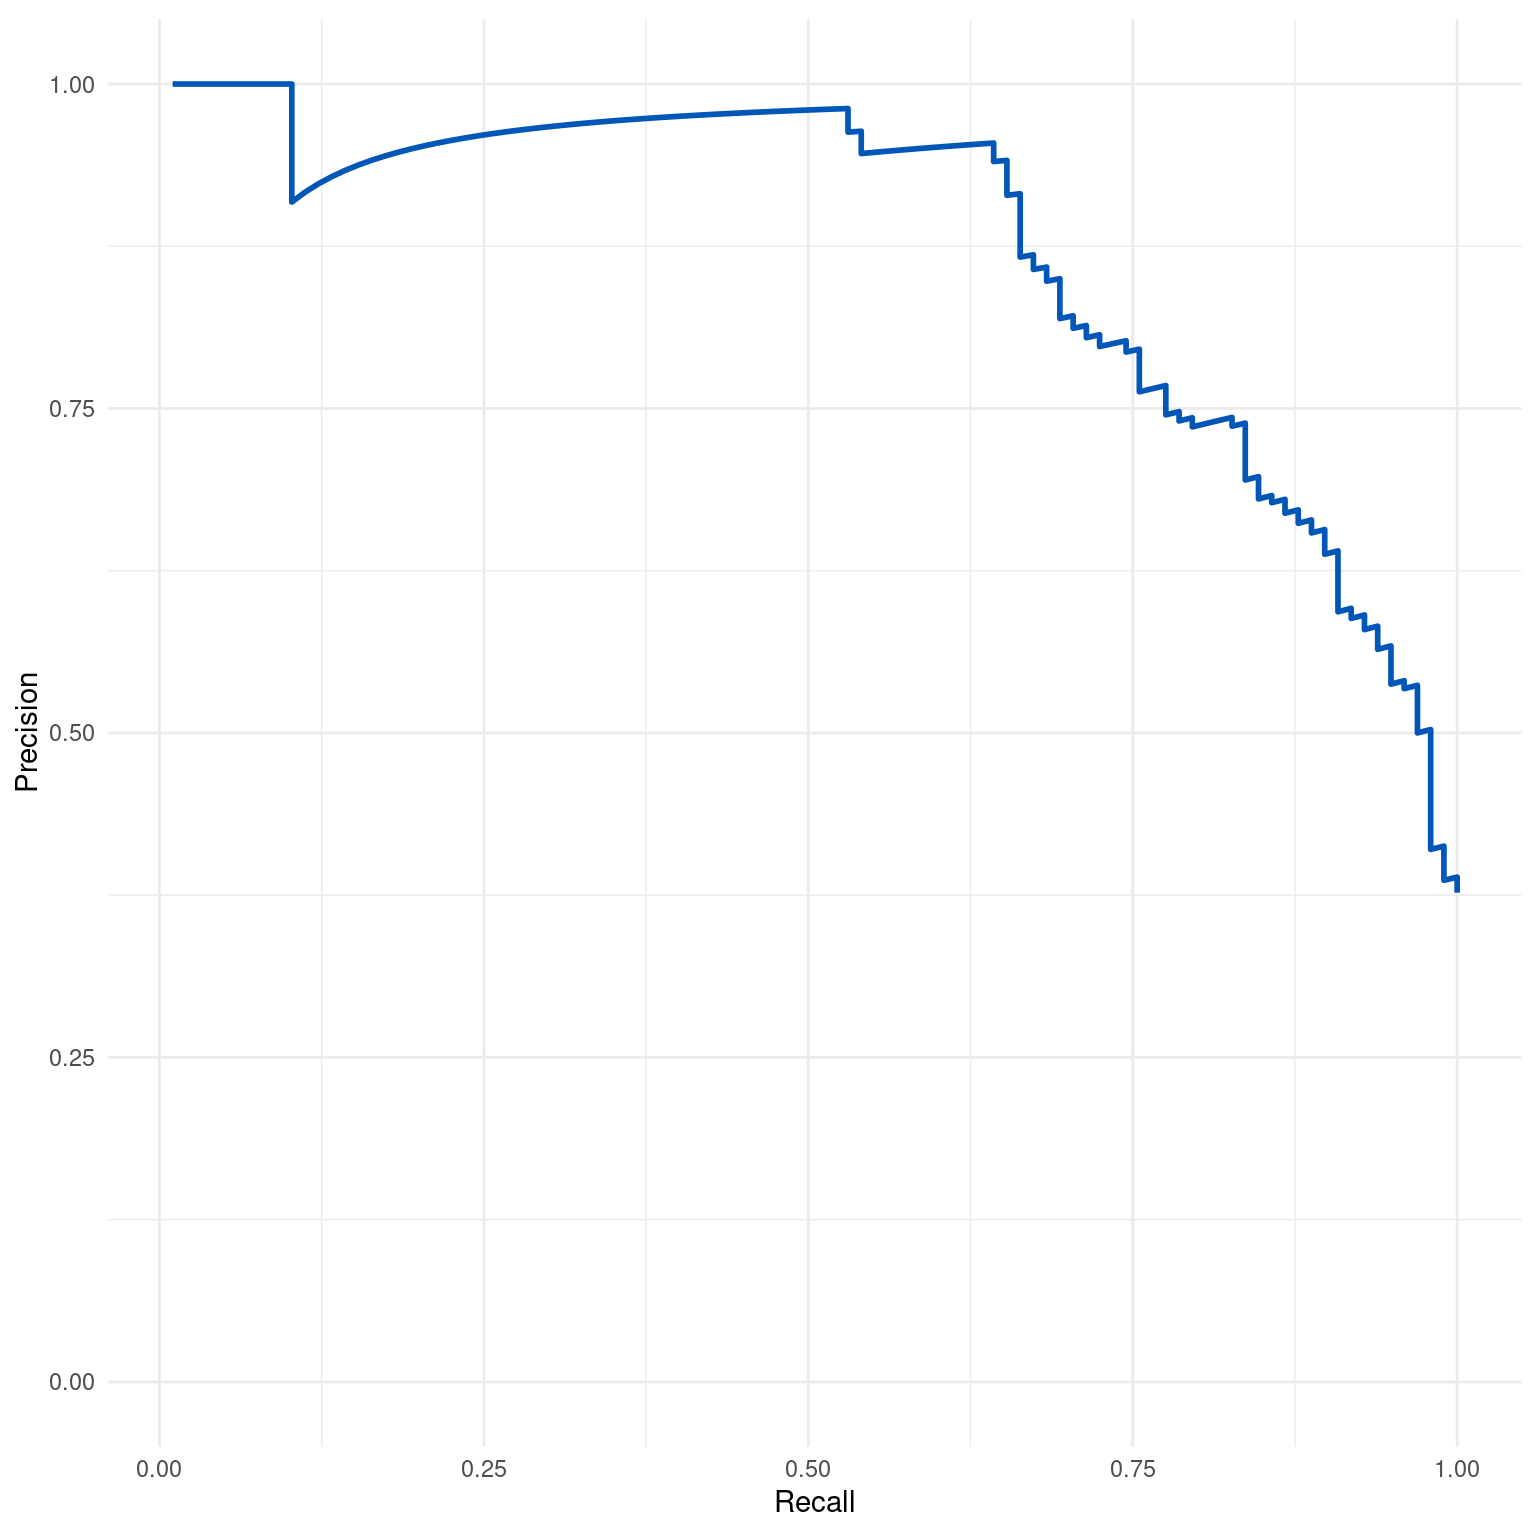
Plots a Precision-Recall (PR) curve from a dx object. The PR curve is a useful tool for
evaluating the performance of a binary classification model, especially in situations where
classes are imbalanced. It shows the trade-off between precision and recall for different
thresholds.
Details
The PR curve is a plot that demonstrates the relationship between precision (the proportion of true positive predictions among all positive predictions) and recall (the proportion of true positive predictions among all actual positives), for each possible cut-off threshold. A model with perfect performance would show a line that reaches the top-right corner of the plot, indicating both high precision and recall. The area under the PR curve (AUPRC) can also be used as a summary measure of the model performance, with higher values indicating better performance. This function generates the curve without calculating the area; separate functions should be used if AUPRC is required.
Examples
dx_obj <- dx(
  data = dx_heart_failure,
  true_varname = "truth",
  pred_varname = "predicted",
  outcome_label = "Heart Attack",
  setthreshold = .3
)
dx_plot_pr(dx_obj)

