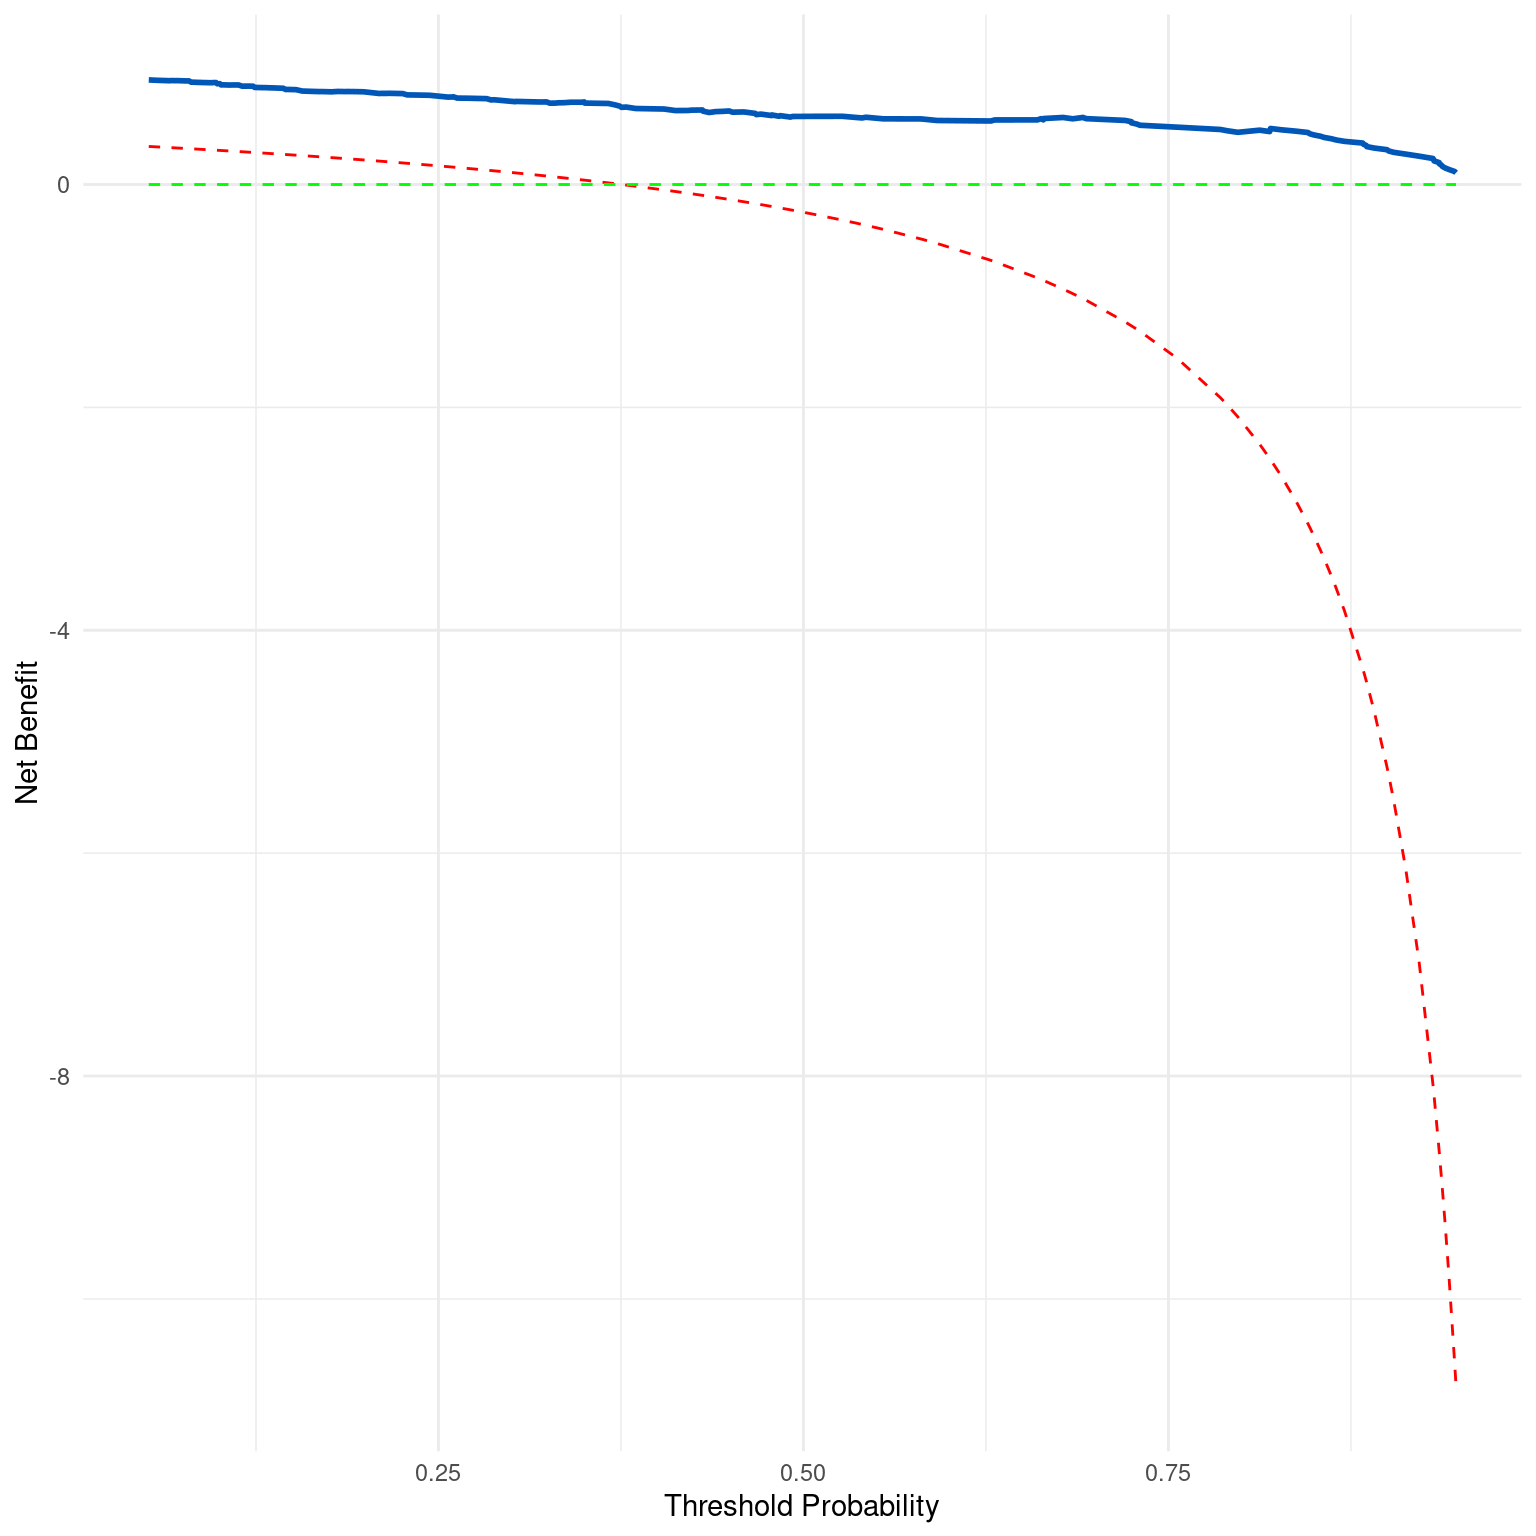
Generates a decision curve to visualize the net benefit of a binary classification model across a specified range of threshold probabilities. The decision curve shows the net benefit of using the model at different threshold probabilities compared to the strategy of treating all or none.
Usage
dx_plot_decision_curve(dx_obj, plot_range = c(0.05, 0.95))Details
Decision Curve Analysis (DCA) is a method for evaluating and comparing the clinical usefulness of prediction models by considering the clinical consequences of decision making. The decision curve plots the net benefit of using the model across a range of threshold probabilities for making a decision. The net benefit is calculated as the true positive rate (sensitivity) minus the weighted false positive rate, where the weight is the ratio of the cost of false positives relative to the benefit of true positives. This ratio is derived from the threshold probability: $$Net Benefit = Sensitivity - (Weight * False Positive Rate)$$ where Weight = Threshold / (1 - Threshold).
The decision curve will typically be compared against two default strategies: treating all patients or treating none. The net benefit is higher when the model's predictions provide a clear advantage over these default strategies. A well-performing model will have a decision curve that stays above the treat-none and treat-all lines for a range of clinically relevant threshold probabilities.
The 'plot_range' parameter allows limiting the analysis to a relevant range of thresholds, avoiding the extremes where the net benefit calculation can become unstable or not clinically relevant.
Examples
dx_obj <- dx(
  data = dx_heart_failure,
  true_varname = "truth",
  pred_varname = "predicted",
  outcome_label = "Heart Attack",
  setthreshold = .3
)
dx_plot_decision_curve(dx_obj)

